Description #
Through the use Propeller P2 smart pins it is easy to measure the frequency, periods and duty cycle of input signals. This Quick Byte shows how to monitor the output of a TSL235R Light-to-Frequency Sensor.
The output of the TSL235R Light-to-Frequency Sensor is a square wave that varies from 0 Hz (total darkness) to approx. 580 kHz (full brightness). The waveform generally has a constant 50% duty cycle. The sensor is very sensitive to light variations so its frequency output is usually a bit jittery.
Presentations of the measurements are easy to do with the Propeller P2 when using available Debug commands/windows, a MAX7219 8-digit LED display or other suitable displays.
Two frequency measurement routines are used in these examples; one uses 2 smart pins to measure frequency and periods, and the other uses 3 smart pins to measure frequency, periods and duty cycles. Which one you use depends on whether or not you want to measure duty cycles or just conserve the number of overall pins being used. The routines return both the integer and fractional amounts of the frequency and duty cycle measurements.
The program examples include the usage of the PNut and PropTool built-in graphical Debug commands/windows to display/present the measured data. At the time of writing this Quick Byte, FlexSpin in the FlexProp environment only supports the simple Debug text line display window. See the comments within the programs and support routine files for more details.
Videos
The above video showed the output of the TSL235R Light-to-Frequency Sensor while the LED was driven over a PWM range of 1 to 255 [1-99%].
In order to show the LED brightness changing the sensor and LED were left uncovered/visible, so the ambient/bright light used to make the video caused the output of the sensor to be approx. 100 kHz even with the LED at its minimum brightness.
The following video shows the output of the TSL235R Light-to-Frequency Sensor while the LED was driven over a PWM range of 0 to 256 [0-100%] with the LED and sensor covered so no external light was contributing to the measurements. The measurements for the 0-10 PWM range in the video are held longer to give you a better chance to see the change in values. You will notice that the TSL235R frequency output tops out at 580 kHz with a setting of 239 PWM. Depending on the LED used and the distance from the TSL235R Light-to-Frequency Sensor, different values/ranges will result.
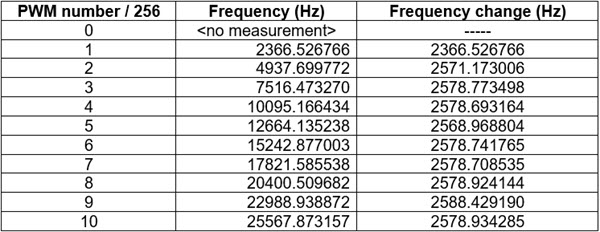
The following table shows the changes in the output Frequency values for each PWM value from 0 to 10. As you can see the Frequency changes approx. 2500 Hz for each small change in LED brightness.
Source Code Included
There are 6 programs presented and included in this Quick Byte:
- fb_measTSL235R.spin2
Read frequency output of TSL235R sensor using a P2 Propeller.
Frequency, period and duty cycle are displayed in a Debug TERM. - fb_measTSL235R_LED.spin2
Read frequency output of TSL235R sensor using a P2 Propeller.
Frequency output is displayed on an 8-digit LED display and optionally in a Debug TERM. - fb_measTSL235R_LED_PWM_scope_term.spin2
Read frequency output of TSL235R sensor using a P2 Propeller.
Use a LED driven with a PWM signal to stimulate the TSL235R.
Frequency output is displayed in a Debug TERM window.
The LED PWM waveform is displayed in a Debug SCOPE window. - fb_measTSL235R_LED_scope.spin2
Read Frequency output of TSL235R sensor using a P2 Propeller.
Frequency output is displayed on an 8-digit LED display and optionally in a Debug SCOPE window. - fb_measTSL235R_LED_scope_term.spin2
Read Frequency output of TSL235R sensor using a P2 Propeller.
Frequency output is displayed on an 8-digit LED display and optionally in a Debug SCOPE and TERM window. - fb_measTSL235R_LED_scopeFFT.spin2
Read Frequency output of TSL235R sensor using a P2 Propeller.
Frequency output is displayed on an 8-digit LED display and optionally in Debug SCOPE and FFT windows.
There are 6 support routines used in this Quick Byte:
- fb_measfreq2P.spin2
Read frequency, periods using 2 P2 smart pins. - fb_measfreq3P.spin2
Read frequency, periods, duty cycle using 3 P2 smart pins. - fb_simpleScope.spin2
Uses a smart pin in ADC input mode and displays waveforms on DEBUG Scope. - fb_simpleScopeFFT.spin2
Uses a smart pin in ADC input mode and displays waveforms on DEBUG Scope and a Fourier series on DEBUG FFT window. - jm_max7219_sp.spin2 [by Jon McPhalen]
Simple MAX7219/MAX7221 serial LED driver (one device)
* SPI signals to MAX72xx are generated by P2 smart pins. - jm_pwm.spin2 [by Jon McPhalen]
Smart pin PWM control.
Parts Used #
- P2 Edge Module (#P2-EC)
- P2 Edge Mini Breakout Board (#54019)
- P2 Eval Mini Prototyping Add-on Board (#64006E)
- - or -
- P2 Edge Breadboard (#64020)
- - and -
- TSL235 Light to Frequency Converter (#604-00084)
- LED, White, T1-3/4
- 0.1 uF capacitor (optional)
- MAX7219 8-digit LED display module (optional #26972)
- Jumper wires (800-00016)


